Unfortunately due to personal reasons I haven’t been able to blog for a while. I am hoping I can change that and this will be one of those small blog posts. Recently on Microsoft Q&A there was question if you can get all Azure VMs with Period Assessment (Azure Update Manager feature) enabled.
Continue reading “Tip: KQL Query for Azure VMs with Periodic Assessment Enabled”Do not use tags for filtering security related Azure Policies
I spend a lot of time on Microsoft Q&A trying to help people by not just providing with answers but also educating them and pushing them to learn more. Recently I was asked to help with Azure Policy rule and I did.
Azure Log Alert scoped to resource that sends logs to more than one Log Analytics workspace
When you configure diagnostic settings you have the option to configure more than one thus send the logs and metrics to multiple Log Analytics workspaces. At t he same time Log Alert v2 allows you to scope your alerts not only to Log Analytics workspace but also to a specific resource or resource group. When the scope is a resource that is not the Log Analytics workspace or resource group than the Log Alert automatically finds to which workspace the logs are send and uses the data from there. But what happens if you are sending the logs and metrics to more than one Log Analytics workspace?
Azure Monitor Workspace, Managed Prometheus and Prometheus Alerts via Bicep

Recently Azure Monitor team has introduced Azure Monitor workspace. This is a new resource that is described as "Azure Monitor workspaces will eventually contain all metric data collected by Azure Monitor. Currently, the only data hosted by an Azure Monitor workspace is Prometheus metrics.". So basically this new resource is a store for metrics and in future will also support Azure resource metrics. This is similar to Azure Log Analytics workspace which is store for logs. Of course Azure Log Analytics can also store metrics but Azure Monitor workspace is optimized for the structure of metrics data. We are yet to see full picture of this initiative. Currently Azure Monitor workspace is known also as Azure Monitor managed service for Prometheus (Managed Prometheus). The full documentation on this new feature/service you can find here. As a long time user and expert on Azure Monitor and Log Analytics I wanted to try this feature and test its capabilities. My knowledge on Prometheus and Grafana is very little so I always like to challenge myself with such exercises. This new feature has 3 distinct scenarios:
- Using Prometheus and Grafana only – you do not have to use Log Analytics and Container Insights
- Using Prometheus and Grafana along with Log Analytics and Container Insights
- Use your own Prometheus server and send data to Azure Monitor workspace and visualize it in Grafana. You can use Log Analytics and Container Insights as additional monitoring as well.
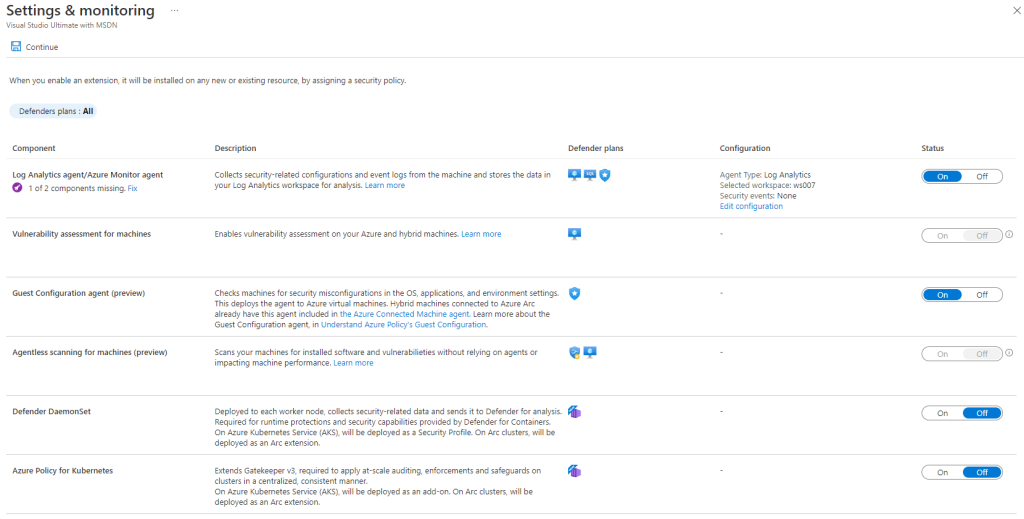
Enable Defender for Cloud Auto provisioning agents via Bicep
Often I see questions around how I can the auto provisioning agents capabilities (now renamed to Settings & monitoring) in Defender for Cloud via API.